Cycle Trace view
Like the Matrix view, the Cycle Trace view can help to visualize files containing a largeWhat constitutes 'large' depends on your screen resolution, but is probably any value greater than about 10. number of traces. The problem is that in the default Chart view, with each trace displayed on a separate axis, the vertical axes become so compressed that each trace looks more-or-less like a flat line. Furthermore, the scale values on the axes cannot be read because the edit boxes overlap. One solution in the standard view would be to place all the traces onto a single axis. This expands the available vertical space, but the traces superimpose on each other, which makes them hard to distinguish.
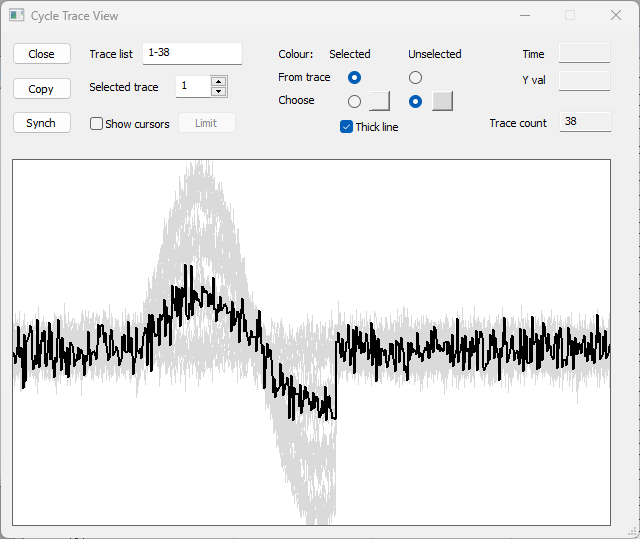
The Cycle Traces view does indeed place all (or a selected subset) of traces on a single axis, but it highlights a user-selected trace. The user can cycle through each trace in turn, and see it highlighted, but in the context of all the other traces.
- Load the file many traces.
This file has 38 traces showing constructed data. Each trace consists of random noise plus a superimposed fragment of a sine wave. The sine wave has constant frequency but 4 differentThe smallest is 0 - i.e., no sine wave at all. amplitudes, randomly distributed between traces.
- Select the View: Cycle trace view menu command to open the Cycle Trace view.
The timebase is linked to the timebase of the main Chart view, and the gain and vertical position is linked axis 1 in the main view, which is automatically selected. The display can thus be shifted using the standard toolbar buttons in the main view. Like the Matrix view, the Cycle trace view is non modal, so you can switch between main view windows showing different files, and the Cycle trace view updates accordingly.
In the view, the Trace list shows 1-38, meaning that all the traces in the file are displayed. If desired, you could edit this to only display a subset of traces. All the traces are displayed in light grey, except for the Selected trace 1, which is shown in black, with a thicker line.
- Repeatedly click the up-arrow of the Selected trace spin button.
- Note how the selection updates so that you can see the different amplitudes of sine wave present in each trace.
- Click in the view near the peak of the largest excursions. The trace with a node nearest to the click point will become the selected trace.
Limit cursors
- Click the the Gain down button (
 ) in the main toolbar.
 - Check the Show cursors box.
- Two horizontal cursors appear.
- Drag the lower cursor down so that it is below the largest negative excursion in the traces.
- Drag the upper cursor slightly up, so that it cuts through the mid-point in the noise at the peak of the selected trace.
- Click the Limit button (which was disabled until the cursors were shown).
Now only traces that cross one or both of the cursors are shown, and these are the traces with the large-amplitude sine wave. The Trace list shows a discontinuous set of trace IDs (2 6 8 17 18 20 22 26 27 33), which are those traces.
- Click the Synch button.
The main view now shows just the traces with the large amplitude sine wave, and these are all placed to display on axis 1. The other traces are placed on axis 2, but that axis is hidden (you can select the Traces: Format menu command to check this).