Contents
Measure
Hover mouse
Click-and-list
Drag box
Events
Cursors
Cursor details
List data values
Trace stats
Measure time and data values
- Load the file cpr intra extra. This will be used as the base for the examples described in this section.
There are many different ways of making measurements from data. Here are some of them.
Hover the mouse
- Hover the mouse over the membrane potential between spikes in trace 1 (the intracellular recording).
The status bar at the bottom-right of the main frame shows the time at the cursor location, and the data value represented by that point on the screen within the axis region in which the cursor is located. The data value should read approximately -57 mV. The accuracy of measurement is limited by the screen resolution, and there are numerous other ways of measuring specific time and data values, but this gives quick and easy access to approximate values.
- If you right-click the mouse, a context menu offers the Copy time and voltage command which copies the displayed values to the clipboard.
NOTE: make sure that if a trace overlaps into more than one axis region, you do not assume that a measurement made in one region applies to a trace originating in another.
Click-and-list
- Select the Analyse: Measure data: Click-and-list command to display the non-modal Measurements dialog box.
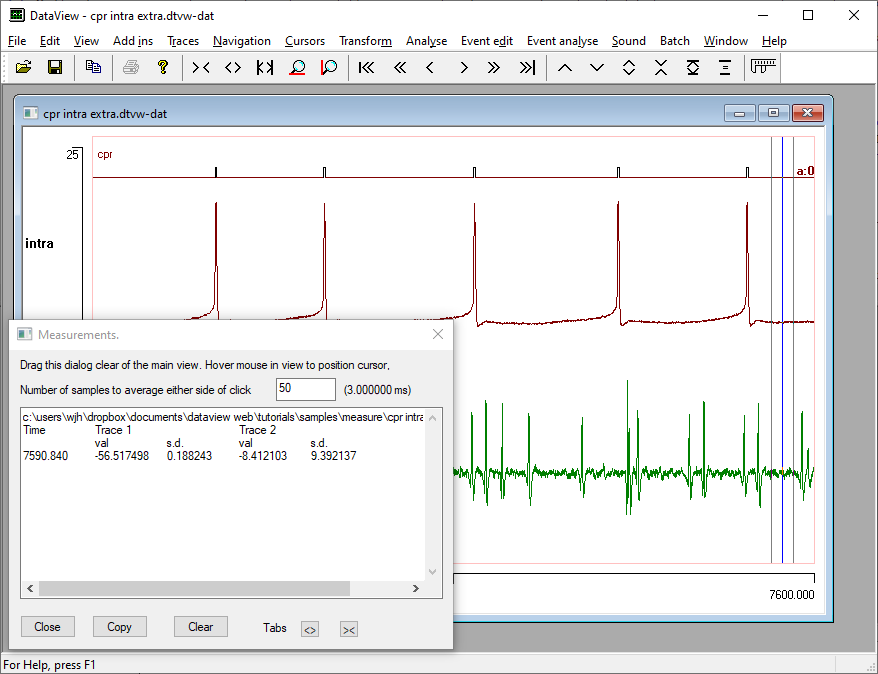
When you move the mouse over the main display, a blue vertical cursor tracks the mouse. When you left-click, the time at the current cursor position appears in the dialog box, along with a list of the values of all displayed traces at that time. The accuracy of the time measurement is limited to the accuracy that the screen resolution allows – a highly compressed display will be less accurate than an expanded display. The trace data values are read from the raw data, and are accurate for the times listed.
Multiple measurements can be made, and the screen display can be adjusted between measurements as desired. You can copy all measurements to the clipboard.
As well as making single data value measurements at the specified time, you can average data values over a selected time window on either side of the click point, which can be useful to prevent noise outliers contaminating the data value measurements. Margin cursors on either side of the main cursor give a visual indication of the duration of the time window.
- Set 50 as the Number of samples to average either side of click.
- Move the mouse to the approximate location shown below, and click.

Drag a measure box
This facility allows you to quickly measure the voltage and time difference between different screen locations, and to get some summary statistics of trace values within the box.
- Select the Analyse: Measure data: Measure box menu command, or click the calliper toobar button (
 ).
).
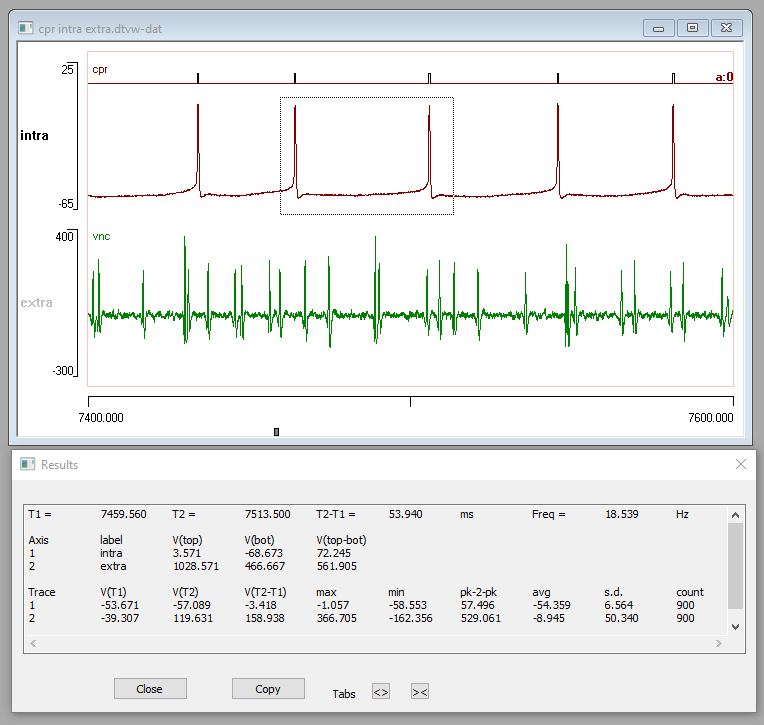
When the command is active, the mouse cursor turns into a cross, and the mouse becomes restricted to the display area of the main view. Click-and-drag the mouse to draw a box on the screen. When you release the mouse button, a Results dialog box appears showing several measurements.
- Resize the Results dialog by dragging on an edge until you can see all its contents.
- If necessary, click Tab the expand button (
 ) to align data values with the header text.

The Results dialog shows the following informtion:
Time
- T1: The time at the left edge of the box.
- T2: The time at the right edge of the box.
- T2 - T1: The time difference (i.e. the width of the box).
- Freq: The time difference expressed as instantaneous frequency.
These values are limited to the accuracy that the screen resolution allows – a highly compressed display will be less accurate than an expanded display.
Value
For each axis in the view the following values are shown.
- V (top): The voltage at the top edge of the box.
- V (bot): The voltage at the bottom edge of the box.
- V (top-bot): The voltage difference (i.e. the height of the box).
Again, these values are limited to the accuracy of the screen resolution.
For each trace the following data values are shown.
- V (T1): The voltage at the time of the left edge of the box,.
- V (T2): The voltage at the time of the right edge of the box.
- V (T2-T1): The voltage difference between these two times.
- max, min: The maximum and minimum values within the box,
- pk-2-pk: The peak-to-peak amplitude within the box (max – min),
- avg: The average value within the box.
- s.d.: The standard deviation of values within the box.
- count: The number of data samples in the trace within the box (will be the same for each trace)
These values are read from the raw data, and are accurate for the times listed.
Measure re events
Events are commonly used to mark regions of interest within a recording. It is therefore useful to have access to event-related numerical parameters.
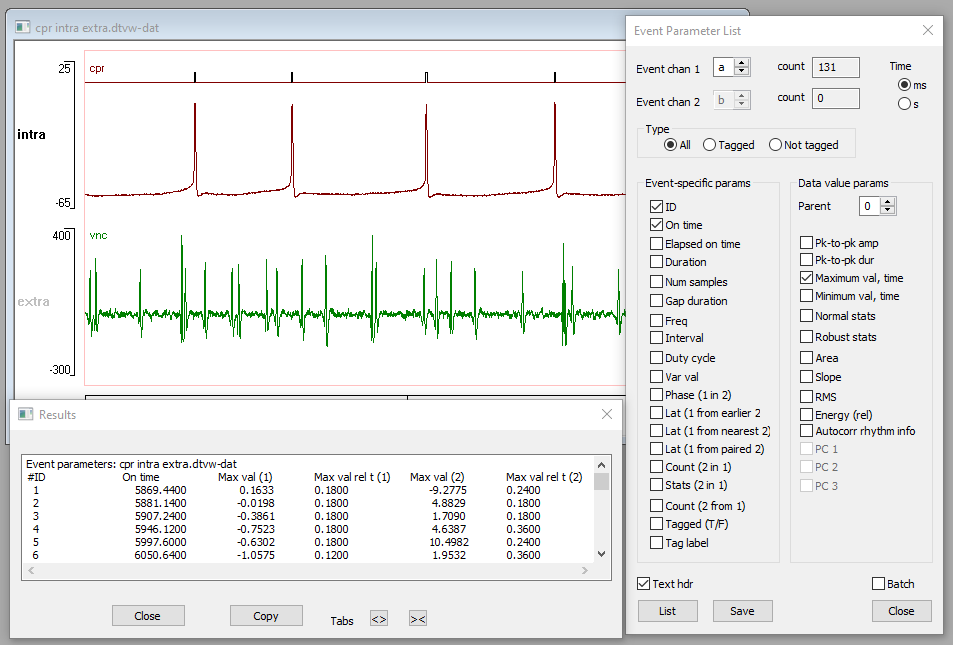
- Select the Analyse: Measure data: Measure re events menu command to display the Event parameter list dialog.
This allows a wide range of measurements to be made related to event timing, and to the values of data traces within the events. The measurements can either be listed in a Results dialog (as shown below), or saved to file.

The same facility is available through the Event analyse: List/save event parameters or Measure re events menu commands. These are maintained for legacy purposes.
Cursors
You can position any number of vertical and horizontal cursors on the screen. Cursors are used to make quick measurements of data, and to demarcate sections of data for various analysis procedures. Cursors are not persistent (they are not stored with the data file), and cursors in each view are independent of each other. Cursors do NOT move with the data, so if you pan the data, the cursor stays in the same screen location. Cursors are controlled through the Cursors menu.
- Select the MultiAdd vert command, and left-click the screen a few times in different locations.
A cursor is positioned at each point you click. Right-click or press the escape key to leave the add cursor mode. After placing a cursor you can drag it to a new position with the mouse, so you don’t have to worry about exact initial placement.
- If you select the Couple cursors option, then when you move one cursor by dragging it all the cursors move by the same amount, so that they maintain their positions relative to each other.
Note that the Place at time command allows you to place cursors at specific times on the screen. Also note that there are similar commands for placing horizontal cursors. You can quickly add a vertical cursor to the centre of the screen by pressing the ‘v’ key, or a horizontal cursor by pressing the ‘h’ key. Make sure the main view has the focus (rather than one of the scale edit boxes) by clicking on it before you press the key.
- Activate the Cursors: Numeric display menu command, and note that you can opt to display cursor IDs, Vert times and Values. The latter two are selected by default.
It may be difficult to read the cursor numeric display text if it overlays data, but you can drag the any text vertically to position it in some convenient location (the Cursors: Numeric display: Reset label positions puts them back in their default location).
The IDs show as V:1, V: 2 etc, and simply give labels to each cursor (some analysis facilities require specification of cursor IDs). The Vert times show the time at that screen location. Note that these times are only as accurate as the screen resolution allows; if you display highly compressed data (slow time-base), then a single screen location (pixel) may cover a quite wide range of times. If you change any aspect of the time-base, or alter the size of the view itself by dragging on the edge of the window, then the cursors stay in the same absolute screen location, and the time values change. The Values show the data values read from the file at the cursor-specified times, and so these change whenever the times change. If you want to get data values at times which are more accurate than can be achieved by cursor positioning, use the Analyse: List data values command.
Detailed Measurements from Cursors
Activate the Cursors: Measure re cursors/times command, and note that the displayed dialog box allows you to make various measurements and calculations (averages, integrals, slopes etc.) based on the cursors. These measurements are displayed in tab-separated format, and can be copied and pasted into programs such as Excel for further processing. You can edit the data before copying if you wish.
List Data Values
The List data values command on the Analyse menu allows you to list a specified number of the data values stored in the file for specified traces, starting at a specified time. This is a quick way of getting access to the exact values of the raw data.
Note you can also access trace values for the visible viewport Edit: Copy: Copy traces as text menu command. This places the text values onto the clipboard in tab-separated format, suitable for pasting into an external program such as Excel.
Trace statistics
The Trace statistics command on the Analyse menu measures normal and robust statistics for specified traces. You can choose the region of the file from which the measurements are made. For large regions (e.g. the whole file with a long recording) a progress dialog displays which enables the user to cancel the measurement if it is taking too long.
Inactive data regions are not included in the analysis.