Contents
Remove mains interference
Remove mains interference
Algorithm
Episodic data
Exclude artefacts
Noise spectrum
Remove Mains Interference
- Open the file noise 50.
This recording is heavily contaminated with mains-frequency interference.
- Select the Transform: Filter: De-buzz menu command to open the De-buzzIt's called that because of the characteristic buzzing sound that mains interference causes on an audio monitor of a recording. dialog.
- Click the Gain up button
(
 )
on the toolbar at the top of the dialog box to increase the amplitude of the signal in the dialog display.
 - The default settings in the dialog are all appropriate for this file, so skip straight to the results by clicking the Preview button at the lower right of the dialog.
The upper trace in the preview shows the original raw data, the lower (red) trace shows the filtered data.

The de-buzz filter evidently does quite a good job of removing the mains interference from the signal.
Algorithm
The de-buzz process works by taking the point-by-point average of several successive sections of a data trace, each section equal to the interference period in length. This generates an interference template by signal averaging. This template is then subtracted from each successive section of the original data signal, leaving, hopefully, the real data signal without the contaminating interference. Any DC component in the template also has to be added back to maintain it in the original signal.
The user has to supply the Noise interval for the interference period to the programme, but the two most likely values of 60 Hz (USA) and 50 Hz (most of the rest of the world) are supplied as pre-set options.
In theory we could de-buzz an entire recording using one template derived from the whole record. However, in practice, this doesn’t work very well. There are three problems.
- Interference is often not stable over a long period – it undergoes subtle changes in shape and waveform as the recording and environmental conditions change over time. This means that the template may need to be updated over time. The Number of cycles in template average parameter sets the limit to the cycles contributing to the template. Once the initial template has been subtracted from all the data that contributed to it, the template is updated by dropping the first interference cycle from the average, and adding the cycle that immediately follows the initial transform period. The next cycle period of the recording is processed using this updated template, and then the template is updated again. In this way the template is maintained as a rolling average that continuously updates throughout the process.
- If the original record is episodic, we absolutely must restart both the averaging and the subtraction process at each episode boundary, since there will almost inevitably be a phase shift in the interference at this point.
- If there are large amplitude but brief elements in the real signal (such as stimulus artefacts) these may contaminate the template, and then this contamination gets added back into the data at the same interval as the interference, which can make the interference pattern worse than it was to begin with. So sections of data containing brief large real signals must be excluded from the average.
The data in noise 50 are non-episodic and do not have any large artefacts, so the latter two issues do not occur. The first is covered by the number of cycles in the template being limited to 50 (the maximum allowed is 100).
The trace display within the main De-buzz dialog shows 50 overlaid successive sweeps of data as grey traces. Each sweep is one Noise interval in duration, and each has its vertical start position aligned on the first sweep. These sweeps make the first template. There is a horizontal purple line marking the zero value of the sweeps, and a red line that is the average of the grey sweeps, and hence constitutes the initial interference template.
The default noise interval is set to 20 ms, and if there is coherent interference at this interval, then the red line interference template should deviate signicantly from the zero-level purple line. It does.
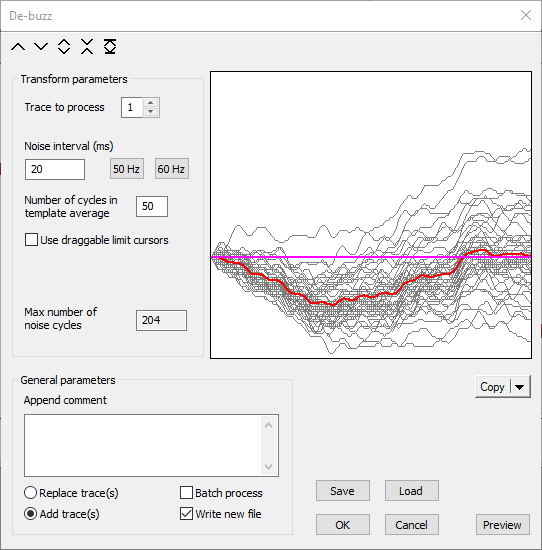
This recording was made in the UK where the mains frequency is 50 Hz, so the interference period does indeed match the template duration of 20 ms.
- As a control trial, click the 60 Hz button.
The template duration is now 16.66 ms and there is no coherence in the data sweeps so the red line average is flat (and disappears under the purple zero-line). The preview shows that the filtered data still has the mains interference. In fact, it is worse because the 60 Hz template adds additional noise.
Episodic data
- Open the file noise 60 (you will have to close the De-buzz dialog unless you start a new instance of Dataview).
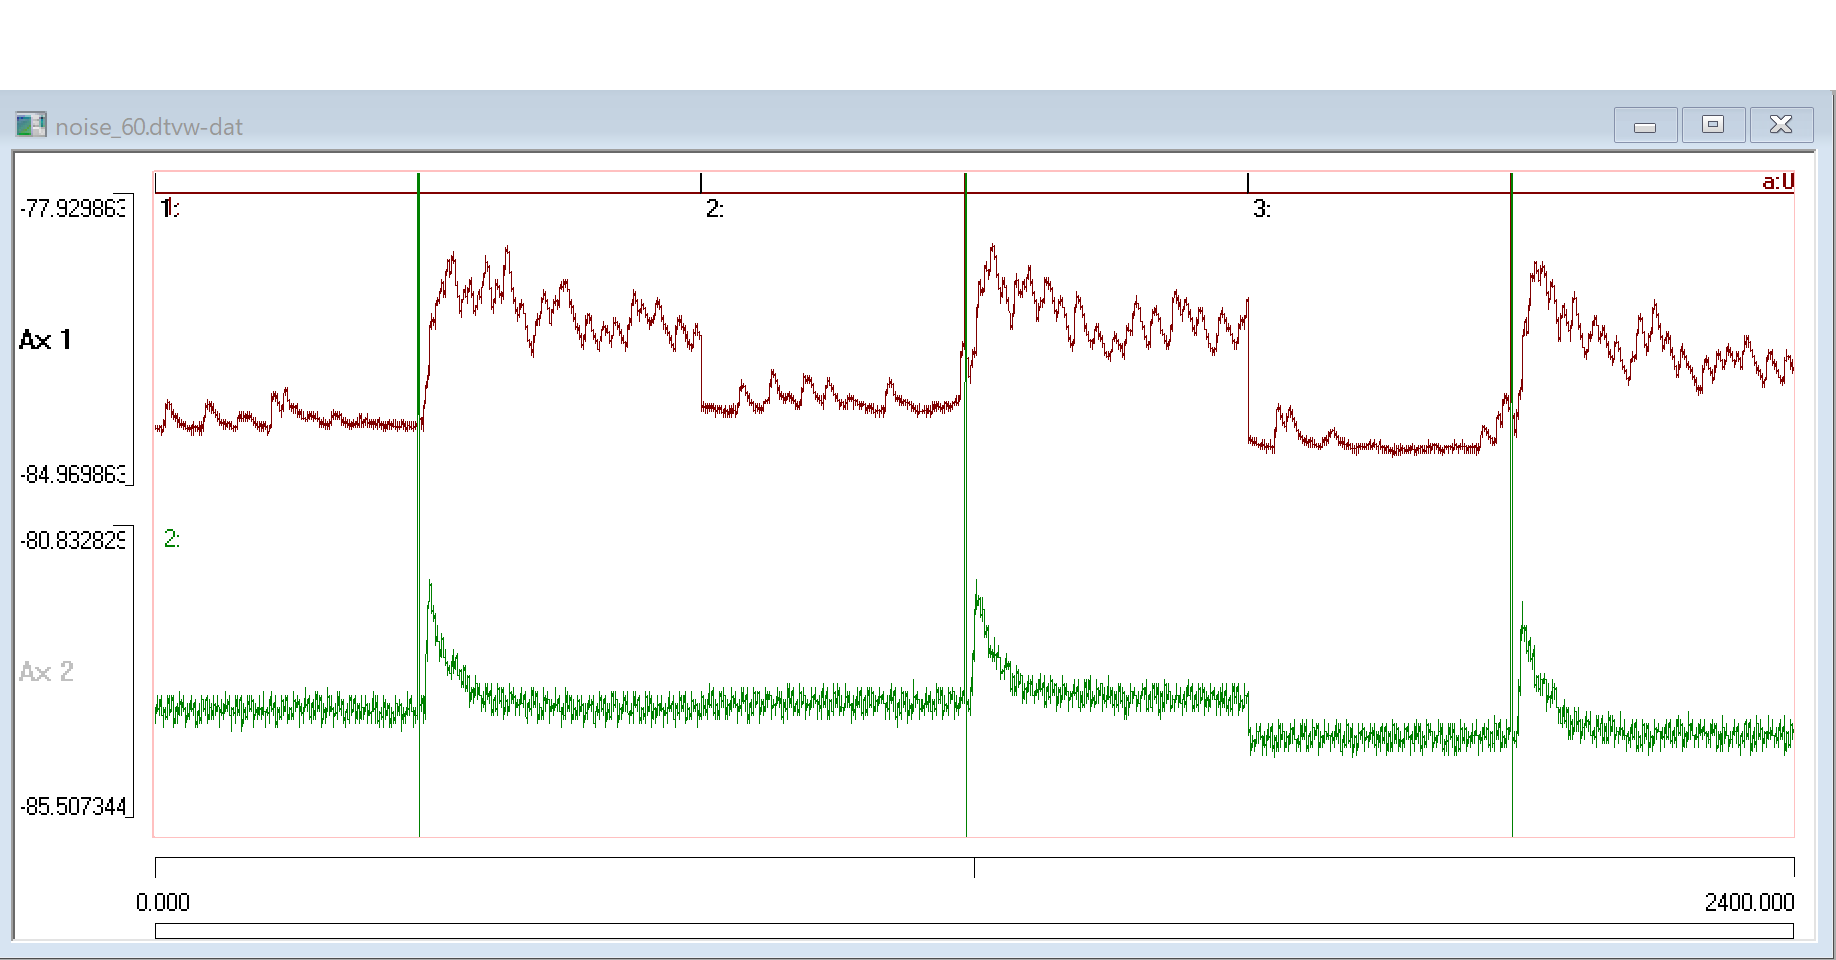
This shows a two channel recording containing 3 episodes, each 800 ms in duration. A stimulus was applied about half way through each episode, and this evokes EPSPs in both traces, but is accompanied by a large stimulus artefact.
- Set the end time (right-hand X axis scale) of the main view to 800 ms, to show just the first episode of the recording.
This is not essential, but it makes the following steps easier to follow.
The upper data trace is relatively clean, but the lower trace is heavily contaminated with mains-frequency interference, which has the crenellated appearance typical of a ground-loop problem.
- Select the Transform: Filter: De-buzz menu command to open the De-buzz dialog.
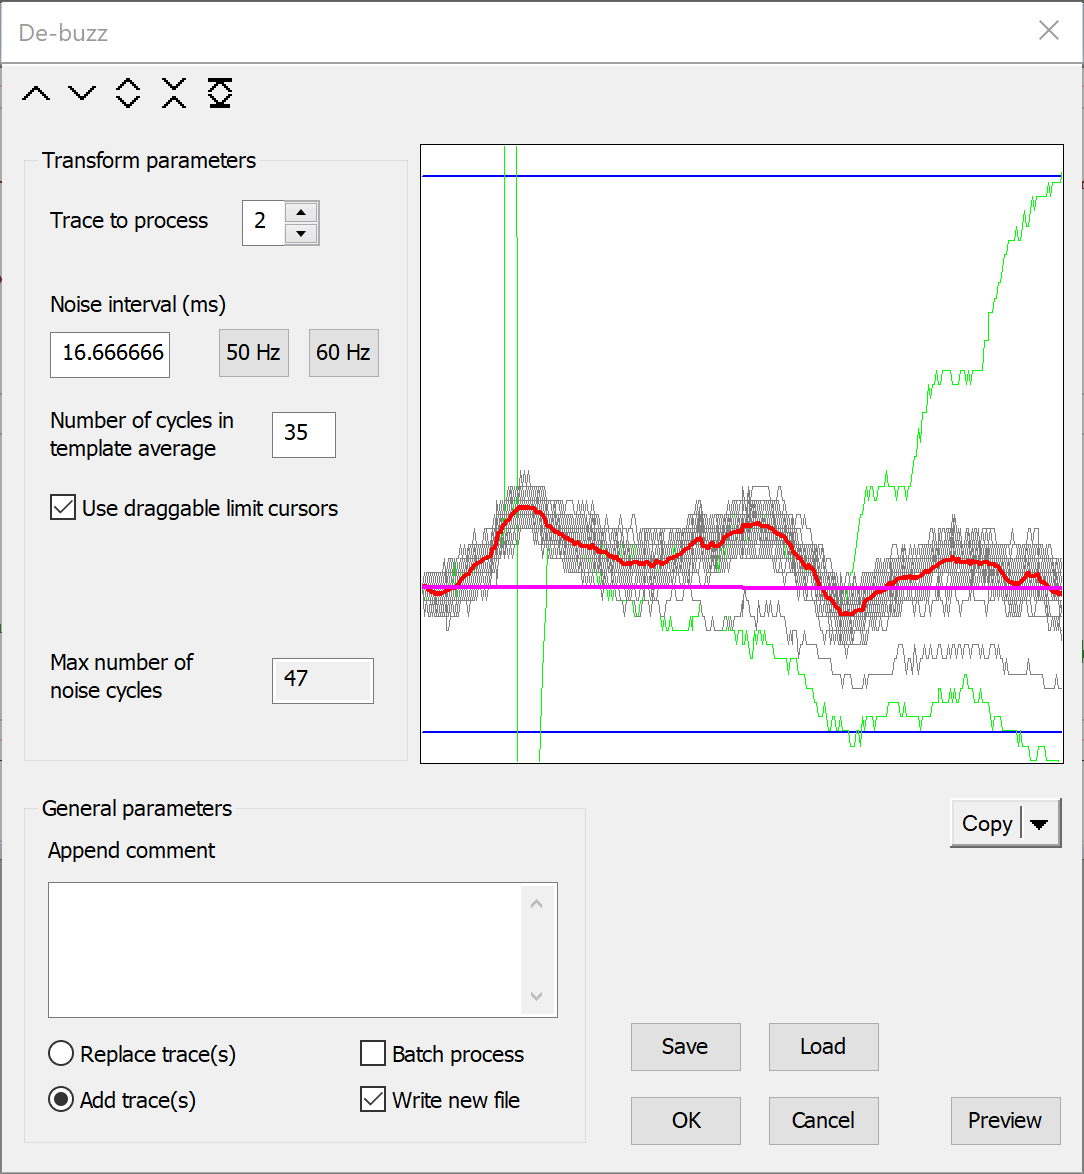
The trace display within the dialog initially shows 35 overlaid successive sweeps of data as grey traces. The reduced Number of cycles in template average is because the programme has detected that the recording is episodic, and has set the number of cycles to the maximum (with some slack) that can be obtained from one episode.
At the moment, there is no coherence in the data sweeps and so the red line average is flat, apart from the deviation caused by the stimulus artefact. The parameters need to be adjusted to see the interference.
- The default settings assume interference is at the 50 Hz of UK mains frequency. However, this recording was made in the USA where mains frequency is 60 Hz. So click the 60 Hz button to set the Noise interval to 16.66+ ms. (You could set the interval directly to an explicit value if your interference was not at either 50 or 60 Hz.)
There is still no coherence in the data, which is actually encouraging because we are looking at trace 1, and the flat red line average indicates that there is no 60 Hz interference in trace 1, thus confirming the visual impression.
- Set the Trace to process to 2.
- Click the Gain up button
(
 )
on the toolbar at the top of the dialog box. Now the interference signal should be obvious, both in the coherent grey traces and the red line average.
The wavy red line is the interference template that will be subtracted from the data. However, there is a problem - the obvious spike near its beginning. This is caused by the stimulus artefact. The artefact only occurs in one of the 35 noise sections comprising the average, but it is so large that it is still apparent after averaging. We will deal with this later.
- Click the Preview button at the bottom-right of the dialog. This opens the Single channel transform preview window.
- Dismiss the warning about episode boundaries.
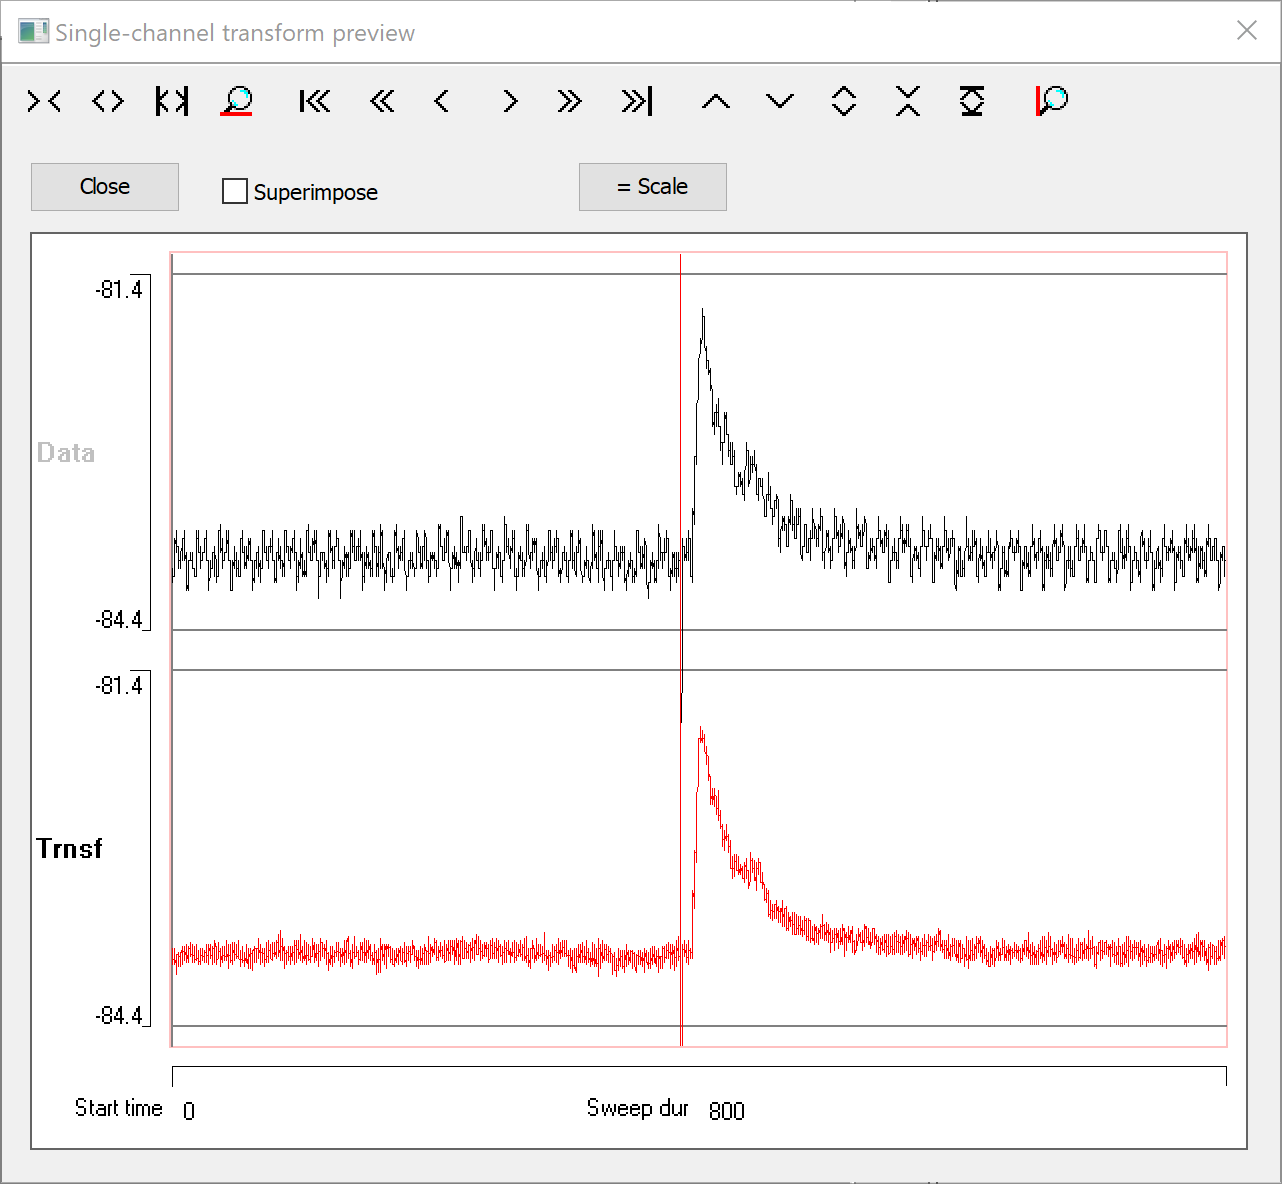
The upper trace in the preview shows the original raw data, the lower (red) trace shows the transformed data. At the moment, the transformed data gain is too low to be useful.
- Click the = Scale button to make the transformed data trace have the same scale as that of the raw data.
The mains interference has been largely eliminated from the trace, which is what we want. However, there are regular vertical spikes at the mains frequency, because a diminished copy of the stimulus artefact has been added to each noise interval. This is definitely not what we want.
Exclude artefacts
We need to exclude the noise period containing the artefact from the average.
- Check the Use draggable limit cursors box in the main dialog.
Two horizontal blue lines appear in the dialog display. These are draggable limit cursors, and any noise sections containing data values that cross these cursors are excluded from the average. Such sections are coloured green in the display. As it happens, the default positions of the blue cursors is pretty much where we want them, but if they were not you could drag them with the mouse.
The wavy red template line now shows the interference signal without the contaminating stimulus artefact, whose sweep is excluded because it crosses the limit cursors. And the annoying vertical lines have disappeared from the Preview display. If you wish, you can repeatedly uncheck and check the limit cursors box, and observe the change in the template and the preview.
We are now ready to actually de-buzz the data
- Click OK in the dialog
- Select a new filename when requested
- When the new file loads, click the Show all button
(
 )
in the main toolbar.
The display should now look something like this:
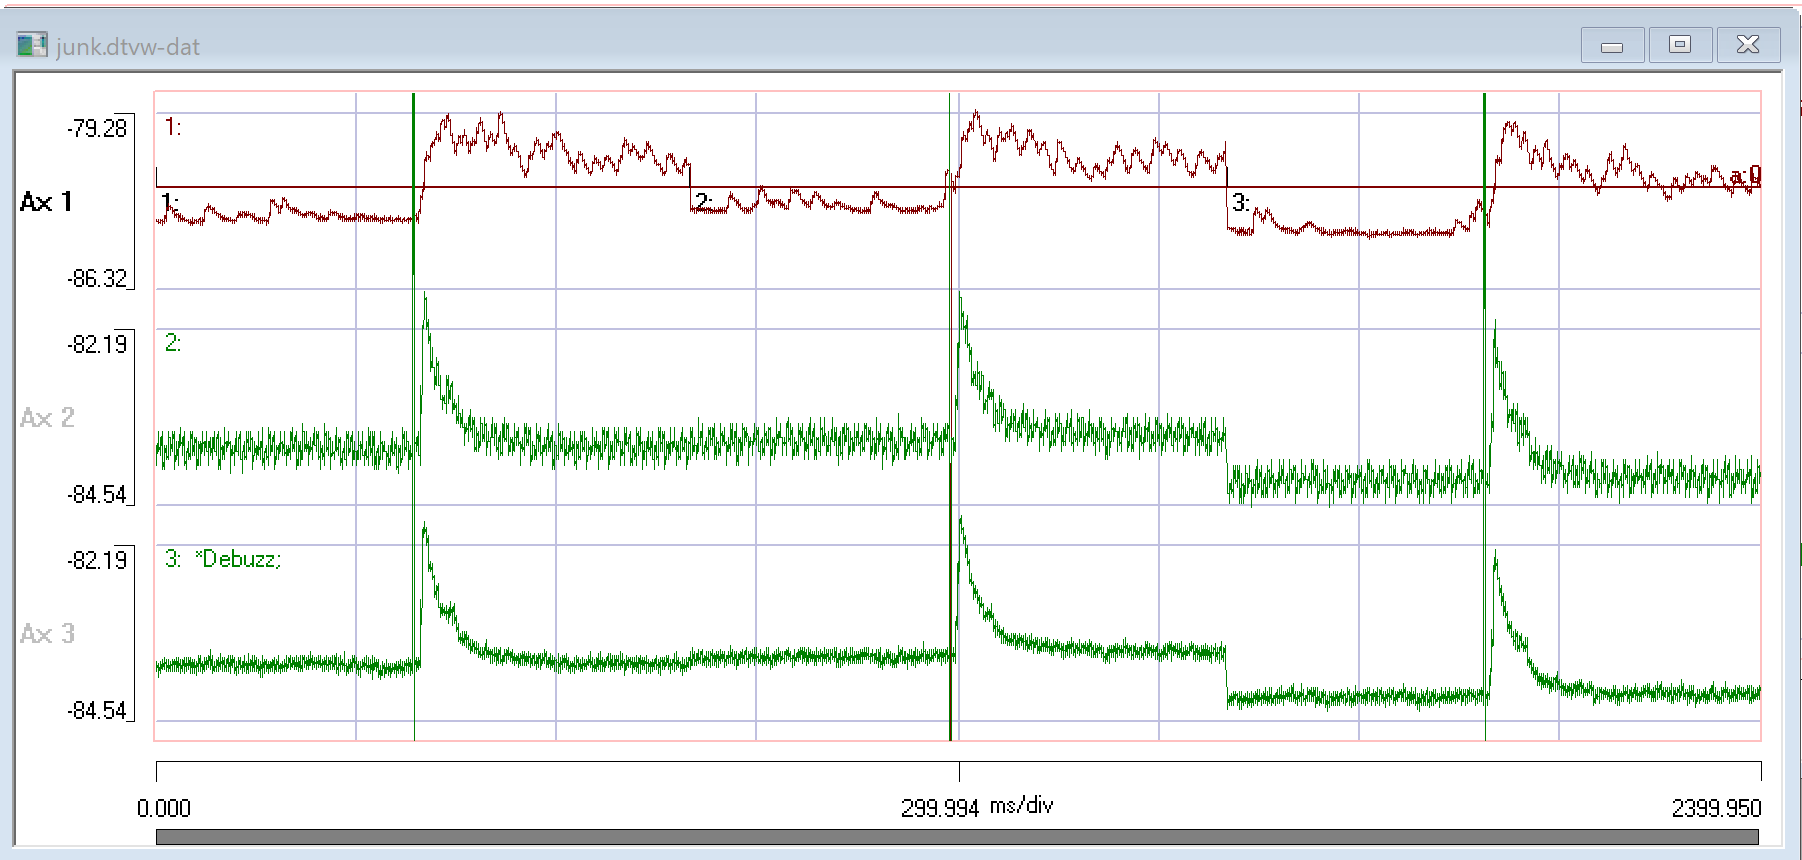
If you wished you could have selected dialog options to replace the original trace 2 rather than adding a new trace. You could also have modified the original file (so long as it was a native Dataview dtvw-dat file not an original acquisition file) rather than writing a new file.
The Noise Spectrum
Spectral analysis of noise 60 shows the effectiveness of the de-buzz process.
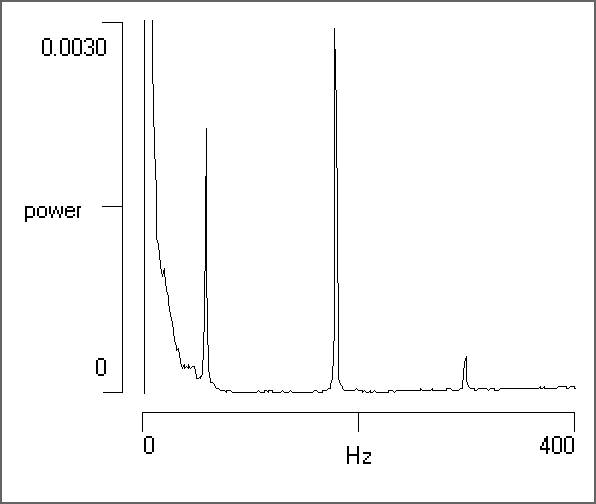
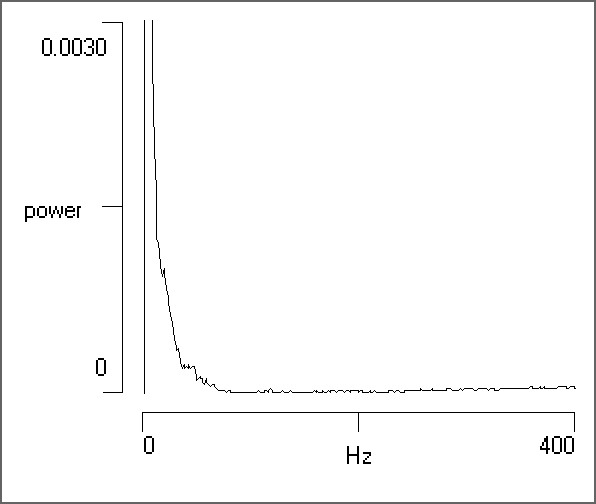
The high power at low frequency reflects the DC component of the membrane potential and the relatively slow evoked potential.