Threshold-Based Event Detection
In principle, threshold-based event detection is extremely simple: successive data values in a trace are examined point-by-point, and if the value crosses a threshold (positive, negative or either) the event starts, and when the data value crosses threshold in the opposite direction, the event ends. Various filters can be appliedThese filters can all be applied post hoc outside this facility through the Event edit: Filter menu after unfiltered threshold detection, but it is often convenient to apply them during detection itself., such as setting a threshold "window" that the peak data value must lie within, or specifying minimum or maximum durations for events, etc. However, usually the most difficult part is deciding on a suitable value for the threshold. This can be done "by eye", or by using the characteristics of the data themselves.
Key Features
We will start with a very simple set of constructed data to demonstrate key features. Then we will look at some real data.
- Load the file threshold 101.
- Select the menu command Event edit: Threshold to open the Threshold dialog.
This dialog is non-modal, so you can carry out other actions without having to dismiss it. The dialog is quite complex so we will only look at its main features here. If you want more information, press F1 to view the built-in help.
A prominent feature within the dialog is the preview window. The duration of the preview is the visible display in the main view, and any changes made there are reflected in the preview.
- Click the Expand timebase button (
 ) in the main toolbar, and note the change in the preview.
 - Click the Compress timebase button (
 ) in the main toolbar to return to the original preview.
User Threshold
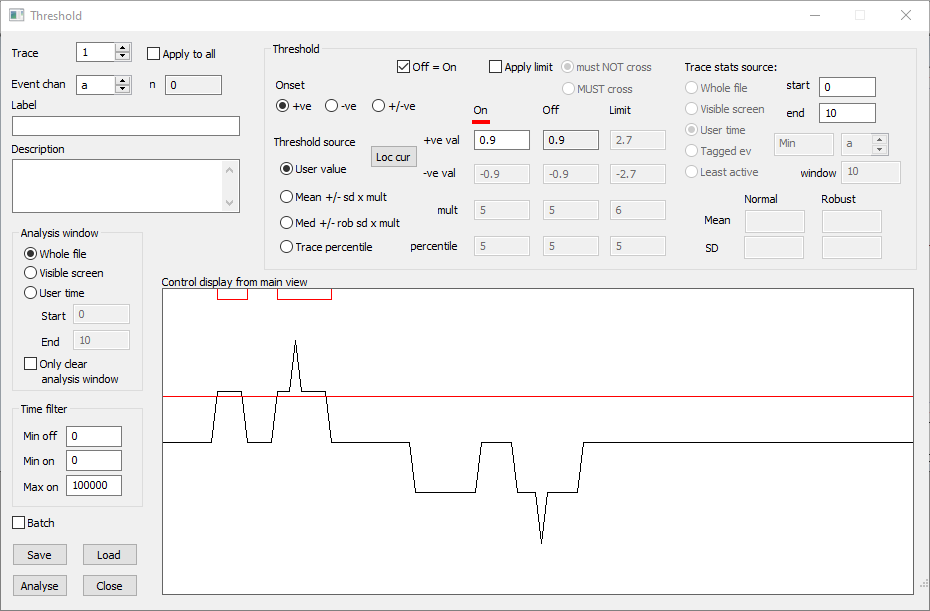
The preview window shows the selected data trace (Trace 1 by default), with a red horizontal cursor indicating the current threshold level.
By default, the threshold source is set to User value, meaning that you set the threshold explicitly (rather than implicitly from the data), and it is set to use positive-going threshold-crossing to mark the start of events (Onset +ve), with the offset threshold set equal to the onset threshold (Off = On is checked). The red horizontal cursor indicates the threshold level, which is listed in the On edit box (under the red marker) and has a value of 0.9.
Both the positive-going deflections in the data cross the threshold value, resulting in two putative events that are shown as red outline boxes at the top of the preview. These start when the data go above 0.9, and stop when the data drop below 0.9. The red boxes represent the events that are detected with the current settings, but at this stage they are just a preview – nothing has been added to the actual data file, you need to click Analyse for that. These preview events update automatically whenever you change a parameter in the dialog.

- Change the threshold value to 1.5.
You could also drag the red cursor upwards with the mouse.
Now only the spike crosses threshold.
- Change the threshold value to 5.
The cursor is no longer visible in the preview - it is above the visible range.
- Click the Loc cur (locate cursor) button .
This brings the cursor back to its default location, which is always within the visible preview. This is convenient if you have lost the cursor when hand-editing the threshold.
- Select the Onset -ve option.
Now the negative-going deflections are detected. Note that the red cursor disappears and a purple cursor appears, with a threshold value of -0.9
- Select the Onset +/-ve option.
Now both red and purple cursors are visible and both positive and negative deflections are detected, yielding 4 putative events.
- Return to the Onset +ve option.
- Uncheck the Off = On box.
You can now have different onset and offset thresholds. - Change the Off value (under the blue marker) to -0.5.
Now there is just one putative event. It starts when the data go above 0.9, but now it continues until the data drop below -0.5.
- Re-check the Off = on box.
Limit filter
- Check the Apply limit box.
A new green cursor appears near the top of the preview, and the Limit edit box becomes enabled, with a default value of 2.7.
- Change the Limit value to 1.5.
You could also drag the green cursor.
The default predicate for the limit is must NOT cross. The spike of the second upward deflection crosses the green cursor, and so the entire event is eliminated.
An alternative design functionality would have been to split the event into two components on either side of the spike. If this is the desired outcome it could be achieved by detecting the spike in a separate event channel, and using the Event edit: Logical: XOR facility.
- Select MUST cross as the limit predicate.
Now the first event is eliminated because no part of it crosses the necessary limit. Note that the entire second deflection still is recognized as an event, not just the part that crosses the limit cursor.
- Un-check the Apply limit box.
Time Filter
- Set the Min off value to 10.
Events which are separated by less than the minimum off time are merged, so in this case the two events detected by raw threshold crossing become one longer event.
- Reset the Min off value to 0.
- Set the Min on value to 8.
The first event is eliminated because its duration is less than 8 ms.
- Set the Min off value to 10 again.
We are back to 1 long event. This is because the filters are applied in top-down order, so once the two raw events have been merged, the resulting longer event now passes the Min on filter.
- Set the Max on value to 10.
Now no events are detected because the merged longer event exceeds the maximum on duration.
Remove the time filters by setting the Min off/on values to 0, and the Max on value to a large number (e.g. 1e8)
NOTE: the above walk-through illustrates the importance of the order in which filters are applied - first the limit filter (if any), then the 3 time filters in top-down order. You will get unexpected results if you do not take the filter order properly into account.
Real Data
- Load the file tadpole.
- Click the Show all toolbar button (
 ).
).
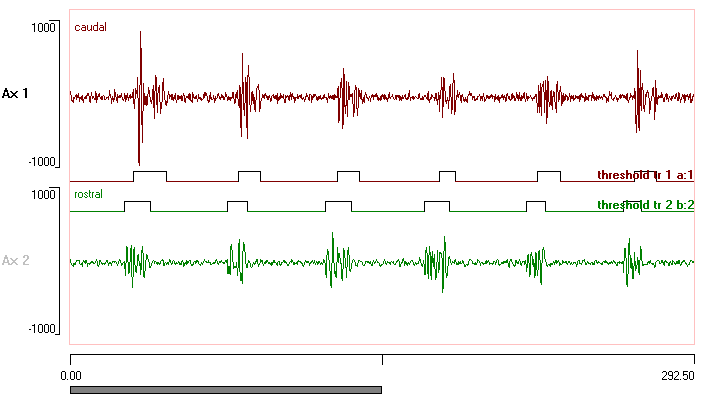
The file shows caudal and rostral ventral root recordings from a tadpole during an episode of fictive swimming.
- Select the Event edit: Threshold menu command to activate the Threshold dialog (or, if it is already active from the walk-through above, click the Loc cur button to set the threshold to its default value).
At the moment only a few spikes in the default Trace 1 cross the cursor and are marked by the red boxes at the top of the preview, indicating putative events.
- Drag the red cursor downwards a bit, and note the increase in the number of putative events.
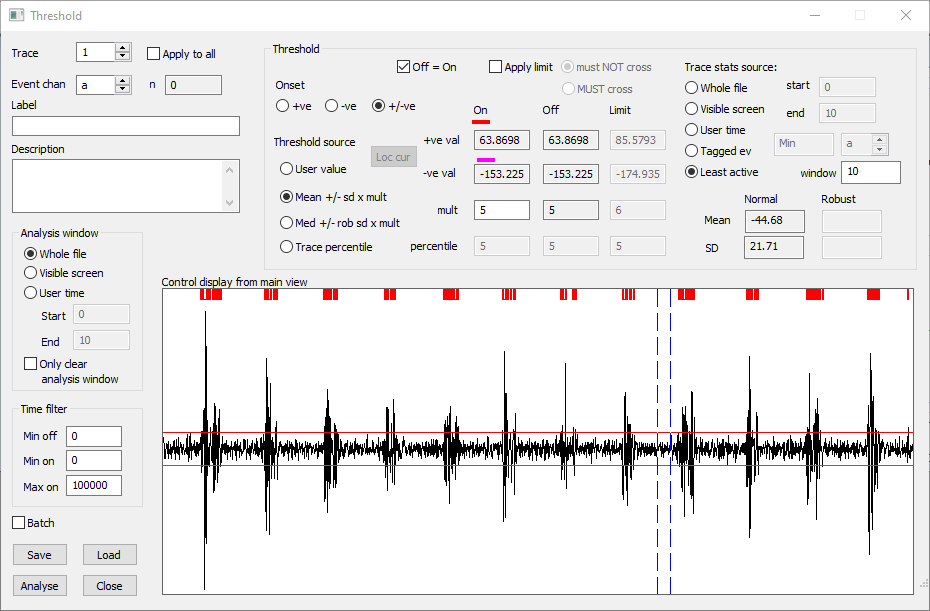
- Set the Onset to +/-ve. Note that a new magenta cursor shows below the zero-line of the data. This means that events will now be detected if the data cross the red cursor in the positive direction or the magenta cursor in the negative direction.
We want to detect the bursts of activity in the recordings, and it would be nice to have an objective criterion for setting the threshold. There are several options, but here is one that is often useful:
- Select mean +/- sd x mult as the Threshold source.
- Set Least active as the Trace stats source (near the top-right of the dialog). Note the value of 10 in the adjacent window edit box.
With these settings Dataview will scan the trace 1 data visible in the main view to find the 10 ms window with the least activity. It then calculates the mean and standard deviation from this section, and sets the thresholds levels as the mean +/- 5 times the standard deviation. You can adjust the threshold within this objective algorithm by changing the mult factor from its default value of 5.
At this point the dialog should look like this:

Time filter
We are now detecting every time the data crosses threshold in either direction. However, we might be more interested in the bursts of activity, rather than the individual spikes. We can detect these using a filter.
- Set the Min off value to 10 in the Time filter group.
This means that events that are separated by a gap of less than 10 ms are merged, as is apparent in the event preview at the top of the preview window.
There is a single very brief event at the end of the recording. This might well be the start of a longer burst, but as it stands it will show as an event with outlier duration.
- Set the Min on value to 2 in the Time filter group.
This means that bursts have to be longer than 2 ms in duration, which can help to prevent detection of spurious threshold crossing. - Switch the data source to Trace 2 to check that the same settings are suitable (you could of course apply different settings to the two traces, but it is nice to be consistent).
Note that the region of least activity indicated by the blue cursors is different in Trace 2, which is not surprising, but the settings appear suitable for both traces.
Apply to all
With just two traces it is entirely reasonable to analyse each trace in turn. However, if there were many traces (and Dataview can handle up to 128) it would be tedious to go through each trace and apply the same analysis.
- Check the Apply to all box at the top of the dialog, beside the Trace edit control.
This means that the same analysis will be applied to all traces in the recording. However, the minimal activity region will be calculated separately for each trace, and hence the threshold values will adapt for each trace. This is probably what you want, but if not then you should choose an explicit user value threshold level. This would be applied to each trace without change. Separate event channels will be written for each trace, starting with the selected channel (which by default is the first empty channel - in this case a).
- Click Apply.
The resulting file should now look like this (but note that layout edits have been made for clarity):

Only clear analysis window
By default, when you click the Analyse button, all pre-existing events in the destination event channel are cleared before the new analysis occurs. If you check the box labelled Only clear analysis window at the bottom of the Analysis window group, then only pre-existing events within the selected analysis window are cleared, any outside the window are left untouched (obviously, this option has no effect if the entire file is selected for analysis).
This option is helpful if you want to analyse discontinuous sections within a data file. This would be useful if, for instance, the recording contains sections with a high noise level that would corrupt the threshold analysis if they were included. You can select the Visible screen option for the Analysis window, and navigate to the various "clean" sections of data and Analyse these in sequence, building up events in the same channel, but missing out the regions with corrupted data. If necessary, you could change the analysis parameters for each viewport.